
Top 50 Common sales Words Used in fmcg business by salesmen

What Do You Mean by Consumer Goods Sector?
Some basic FMCG sales terminologies for the freshers who are planning to start their careers in sales:
FMCG: Fast Moving Consumer Goods, goods that moves faster from a retail outlet.
For example rice, dal, sugar, soap, etc.
Why Factory Orders Matter In Fmcg Business?
Primary Sales: These are sales from the company to the distributor e.g. the amount of product that a distributor purchases from the company. Normally Area Manager’s and Regional Manager’s targets are set on Primary Sales.
Secondary Sales: These are sales from the distributor to the retailer. Usually, TM/TSM’s targets are always based on secondary sales.
Offtakes (Tertiary Sales): These are sales from the retailer to the customer. While offtakes are not tracked by the company, trends of offtakes are tracked by some market research agency like Nielsen.
Beat: This is the route that a salesman (DSR/SO/SR) follows on a particular day. For example, beat on Saturday is Location X, and beat on Sunday is Location Y. If the salesman visits his each beat on every alternative day, all the retailers/stores/outlets in his sales territory will be covered in two days. Thus, he will visit the same outlet of his beat thrice per week.
Numeric Distribution: The number (or percentage) of outlets where company’s product is present (outlets that have at least one SKU of a product) e.g. at how many outlets a company’s product are available is measured by numeric distribution.
Weighted Distribution: The percentage of the total sales volume that comes from the served outlet.
Let’s clear this by an example,
For example, you have 10 outlets in a beat, now out of these 10 outlets if your product is present in 4 outlets then numeric distribution is 40%. If that 4 outlets contributes 75% of your total sales, in that case weighted distribution would be 75%. Numeric distribution gives you an idea of the reach of distribution whilst weighted gives you an idea of the quality of distribution.
Stock Keeping Unit (SKU): This refers to a specific product from a range of product of a company. For example, 100 gram Dettol original soap is an SKU of Dettol soap of Reckitt Benckiser (Reckitt Benckiser has other SKUs of dettol soap like 50 gram Dettol soap, 200 gram Dettol soap, etc.).
Sales Representatives (SR) or Sales Officers (SO): SR/SO can be employed either by company or by distributors depending on company policy who are responsible for collecting sales order from their assigned routes. After collecting sales orders from the outlets of his assigned route, a SR/SO makes a summay of this total order and submits it to the distributor for delivery. Based on this collected order (summary sheet) product delivery happens on the next day by DSR or Deliveryman of distributor. In Bangladesh usually local companies keep SR/SO on their own payroll but MNCs do not keep this layer with their own payroll.
DSR: Distributor’s Sales Representatives are employed by distributors but managed by TM/TSM; DSRs are the salesmen who are responsible to make sales of company’s products (SKUs) to retailers. Typically where SR or SO concept is available, DSRs are the deliverymen who are employed to deliver company’s products to outlets according to previously collected orders by SR/SO. Where SR/SO concept is not practiced (e.g. not employed by company itself) DSR plays the role of SR/SO and in that case distributor employs a separate delivery unit for distributing products to retail.

Sales is the only function in the company that brings revenue and still it is much looked down by most of the job aspirants. If you ask any Marketing student, majority of them will say that they aspire to become a Brand Manager and only few (if you are lucky!) will say that they intent to go into sales and then grow.
It is not just a coincidence that the field, you aspire to rock one day, is called “Sales and Marketing” and not just Marketing or just Sales. S&M comprises of three pillars, which are
1. Sales: Basic function of sales is to generate revenue for the company. It revolve around reaching to customer, convince them to stock your product, give them discount to pass(sell) product to end consumer, achieve monthly sales target and keep everyone happy(!!!).
2. Marketing: Marketing revolve around creating desire among customers to consume your product and there are many ways. Marketing includes decision like selling 50gm pack or 56gm pack, charge 100Rs and give 10% discount or charge 91Rs. It also includes media planning, promotion and tactical activities planning. To accomplish all task you need market data and that comes from Market research and your on-ground employees (salesmen).
3. Innovation: Innovation is long term strategy that includes new product development, positioning and how do you want your product/brand to be perceived in long term.
A company can be classified as
Sales driven: Balaji wafers, Ghadi detergent etc
Marketing driven: Pepsi, Coca-cola etc
Innovation driven: Philips, Apple etc
Marketing and Innovation are cost function and their cost is paid by revenue generated by Sales function of the company. Companies like Pepsi spends 6-7% of revenue on marketing. Last year Pepsi’s market share increased by 2%(click here) and they doubled promotion spend considering increase in revenue will be able to sustain these massive spend. Philips spends nearly 7% of the revenue in R&D to develop next generation products and over the period the R&D spend has increased with increase in revenue. Thus to increase or continue its dominance, companies need to keep investing in their core competency (marketing/innovation) and these increased investment comes from the revenue which is function of sales department.

Basic Responsibilities of Sales Manager:
- Deliver volume
- Exploit maximum market potential
- Ensure stable distribution infrastructure
- Ensure relationship distributors and customers (retailers)
- Develop a capable team
Basic Responsibilities of Sales executive:
- Reach outlet on time
- Sell product
Maximize LPC and BPC - Keep product availability in store
- Maintain Visibility of product in store
- Highlight promotions (promotional schemes)
- Keep product neat and clean
- Build and maintain relationship with retailer
- And deliver volume
Glossary of Sales Terms:
- RTM (Route To Market): Route To Market is the critical link between manufacturing and market. It is a distribution system employed by the company.
- Primary Sales: It is a sales from company to distributors
- Secondary Sales: Sales from distributor to retailers
- Tertiary Sales: Sales from retailer to end consumers. It is also known as “Off-take“.
- Trade schemes: These are promotional schemes that are offered to boost sales from time to time. They can be classified in two categories:
- Primary Scheme: These are deducted while the invoicing is done to the distributor from the company’s end. This may be done to give the distributor an additional margin.
- Secondary Scheme: Distributor is supposed to first extend to the market and then claims it back from the company Qualitative Purchase Schemes: These are schemes which company offers to distributor based on volume he buys
eg. 5% discount on 100 pieces, 7% discount on 150 pieces - Quantitative Purchase Schemes: These are schemes which company offers to distributor based on value of total items bought
eg. 5% on items worth 10000Rs, 7% discount on items worth 15000Rs
- Landing Price: It is a price that buyer pays to seller for purchase of the product
1. Distributor landing price: Per Unit Price distributor pays to compny for purchase of product
2. Retailer Landing Price: Per Unit Price retailer pays to distributor for purchase of product - ROI (Return on Investment): Return on Investment is money earned for the investment made over one year
ROI = 100*(Earning – Expenses)/Investment - Beat Plan: Beat plan is a pre-defined route for sales executive to follow to service the outlets.
- Outlet universe: Total number of outlets which stores product same product category or related product category to which our product belongs
- Coverage: Coverage is number of outlets covered from universe of outlets.
1. Numeric Distribution: Absolute quantitative distribution ie if outlet universe is 100 and my product is present in 60 outlets then Numberic Distribution is 100*60/100 = 60%
2. Weighted Distribution: It is measured based on volume. ie if total volume sales by all outlets in outlet universe is 1000unit and my product is present in outlets which sells 700units then Weighted Distribution is 100*700/100 = 70% - MCP (Master Coverage Plan): At the time of product introduction, MCP is performed to identify and understand market and design distribution plan to meed objectives.
- EDS (Every Dealer Survey): EDS includes visiting every retailer of the are and mapping market potential to design effecient route for coverage
- LPC (Lines Per Call): Number of order lines per order
- BPC (Brands Per Call): Number of brands per order
- FDFT (Fixed Date Fixed Time): Ensuring the Distributor Salesman visits all the potential outlets on a FDFT. This helps to establish DSR reliability
- OOS (Out Of Stock): When product is sold out and retailer is left with no inventory to sell.
- POS (Point of Sales)
- Merchandising: Arranging our Products and POS neatly and prominently so that they are easily noticed by the customer
- PJP (Permanent Journey Plan): It is detailed plan for Sales Manager describing his monthly activities.
Wholesalers: An outlet of a beat is considered as wholesaler if that outlet contributes more than 50% sales of that particular beat (this assumption may differ for different companies).
Modern Trade: Super shops who mainly sell to premium customers e.g. Agora, Swanpa etc. (Modern Trade is managed by the dedicated sales channel)
Trade Schemes or Trade Promotions (Widely Known as TP): These are schemes that are given out in the market to boost sales from time to time. Trade Schemes are designed for the trade i.e. Retailers/Wholesalers and the Distributors.
Trade Promos can be of different types based on the needs of the company:
Typically FMCG companies do have many SKUs in their product portfolio. To create retailer’s loyalty (trade advocacy) companies offer frees or bonuses with some of their SKUs for their retailers. These bonuses are named as TP. For example 12+1 free means that with this particular product an extra item (same product) will be offered to a retailer if he buys 12 items in a single invoice/memo. If another item is given as free the same promotion may be named as Cross Promotion.
Quantity Purchase Schemes (QPS): To inspire the retailers to buy more, sometime company offers QPS.
These typically look like this: Purchase of 144 pieces at a time and get 8% discount
Basically these are discounts offered on purchasing a particular quantity of products.
Value Purchase Schemes (VPS): These are same as QPS, the only difference is that these are offered on value purchased instead of quantity.
These would look like this: Purchase of Tk 10,000.00 at a time and get 8% discount.
These are discounts offered on purchasing products of a predefined value.
Trade schemes are further divided into two types depending on who they are offered to:
Primary Schemes: These are those that are deducted while the invoicing is done to the distributor from the company’s end. This may be done to give the distributor an additional margin.
Secondary Schemes: These are those which the distributor is supposed to first extend to the market as per company declared trade scheme and then claims it back to the company.
Trade Schemes: These are schemes that are given out in the market to boost sales from time to time. Trade Schemes are designed for the trade i.e. Retailers/Whole-Salers and the distributor is supposed to comply with them and extend it to the trade and the company’s sales force are expected to utilize it in the right spirit and ensure market hygiene.
These can be in terms of discounts on the bill (hence translating to higher margins) or in terms of goods that may be enticing for the retailer/distributor. An example of this would be a free air conditioner on purchase of a particular value of goods, or a free holiday package on achieving the target that is given.
Trade schemes are of two types:
Quantity Purchase Schemes (QPS): These typically look like this:
144 pieces – 8% discount
72 pieces – 6% discount
48 pieces – 4% discount
24 pieces – 2% discount
Basically these are discounts offered on purchasing a particular quantity of products
Value Purchase Schemes (VPS): These would look like this:
Purchase of 10,000 – 8% discount
Purchase of 8,000 – 6% discount
Purchase of 6,000– 4% discount
Purchase of 4,000 – 2% discount
These are discounts offered on purchasing products of a predefined value
ROI (Return of Investment): This is calculated on monthly/quarterly/yearly basis to understand distributor’s profitability. ROI calculation is very important as it is a tool to negotiate with your distributor to manage/deploy required investments.
The equation is simple: ROI= Return/Investment, Return = (Earnings – Expenses).
FOC: Free of Cost (Goods offered as free). Sometimes company offers FOC goods to retailers as a part of special promotion.
Display: This refers to Shelf of an outlet that a company pays for (can also be a floor standing unit (FSU) in Modern Trade). Company usually hires shelf space of an outlet on monthly rental basis to display its products.
Strike Rate or Productivity: It is the % of all successful sales calls out of total calls made by a Sales Representative. This is generally measured on daily basis.
ECO: It stands for Effectively Covered Outlet or Effective Coverage which means how many outlets out of total outlet of a route or market or territory are making at least one memo in a month. With ECO a company measures active outlet number over the period of time (normally a month).
Other Popular Terms:
EC: Effective Coverage, PC: Productive Call, LPC: Lines Per Call, LPD: Lines Per Day, LPM: Lines Per Month, LPI: Lines Per Invoice, KPI: Key Performance Indicator, TBTL: Time Bound Trade Load, DLTL: Display Linked Trade Load, NPLP: New Product Launch Process, DP: Dealer Price, TP: Trade Price, TP: Trade Promotion, CP: Consumer Promotion, CO: Consumer Offer, L&D: Leakage & Damage, DD: Direct Distributor, SD: Super Distributor, OSDP: Out Stationed Distribution Point, JC: Journey Cycle, TMR: Town Market Report, Discounts: Primary Discounts, Secondary Discounts, Cash Discounts, ADS: Average Daily Sales, RADS: Required Average Daily Sales, RTM: Route to Market, VTM: Value to Market, BTL: Below the Line, ATL: Above the Line

Top most festival Products FMCG consumers search today
World Wide Festive Trends Decoded What Indian festive consumers seek...
Read More
How right selection of FMCG Salesmen improves brand market share
How can FMCG Companies improve salesman’s technique in order to...
Read More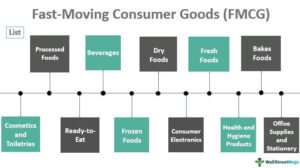
How most searched Fmcg sales and marketing words help newbie salesman
Why undestand FMCG sales management? Sales management is the process...
Read More
How Successful FMCG Salesman Starts his Day, a guide
How does one become a good sales executive in the...
Read More


Thanks for publishing this great article without questions is very useful